Final Project - FIFA Gossips

Let’s Play a game first!
Rumor Quiz:
“Messi can help his team win” — do you think this is True or False?
Why is this the case? Keep reading!
- Part I: Story Prelude
- Part II: Data Visualization
- Part III: Model Validation – Advanced Modeling
- Part IV: Dicussion
- Part V: Behind-the-Scenes Code (jupyter notebook)
Part I: Story Prelude – “The Hidden Truths” of the World Cup?
Every four years, as the FIFA World Cup takes center stage, whispers and “unwritten rules” begin circulating among fans. These rumors, myths, and superstitions may not be scientific, but they’re amusing, emotional, and often oddly persistent.
We’ve handpicked some of the most viral World Cup gossips for you.
How many have you heard before?
⚽ Gossip #1: “If You’ve Got Messi or Ronaldo, You’ve Already Won”
“Bro, it’s Messi. Argentina’s basically already 1–0 up before kickoff.”
“If Ronaldo’s hair doesn’t move, the defense won’t either.”
Some fans believe having Lionel Messi or Cristiano Ronaldo on the pitch is a guaranteed advantage. In their eyes, it’s not just talent, it’s destiny. The logic? If Messi plays, Argentina wins. If Cristiano’s hair is perfectly styled, expect a hat-trick.
These ideas are wildly popular among fans and social media memes.
But are they grounded in reality?
Does the presence of a star player statistically raise a team’s win rate or goal count?
References:
Valverde:always a big advantage to have messi
⚽ Gossip #2: “Play in Your Backyard, Win the Match”
“If France plays in Paris, even Brazil’s samba doesn’t work.”
“Mexico’s high-altitude stadiums? Instant nosebleed for Europeans.”
Football fans love to talk about home turf advantage; the idea that cities like Paris, Buenos Aires, or Mexico City come with invisible boosts: louder fans, local climate, and psychological edge.
Some even claim European teams “can’t breathe” at Mexico’s altitude, or that France “becomes invincible” when in Stade de France.
But is that true?
Does playing in certain cities or countries correlate with higher win rates or goals scored?
References:
Reddit: Why dosen’t the altitude problem seems to exist in
⚽ Gossip #3: “Bad Weather, Worse Football”
“Desert climate beats Europe. Tropical rain beats South America.”
“Germany never wins when it’s hot.”
There’s a myth that climate defeats tactics.
Teams supposedly underperform when playing in foreign weather:
Europeans melt in tropical heat, South Americans can’t handle dry desert air.
Fans claim that if it’s humid, the match outcome is already skewed.
But can we find evidence that climate zones like tropical, arid, or continental actually affect win rates?
Media References:
⚽ Gossip #4: “Some Teams Are Just Cursed (or Blessed)”
“England only loses to penalty shootouts or host nations.”
“Belgium is always the best team to never win.”
“Brazil? They skip quarter-finals and just show up in semis.”
Fans love narratives about traditional powerhouses, some deemed cursed, others legendary.
England’s infamous penalty struggles are a recurring meme.
Belgium’s “golden generation” is often praised, yet never quite delivers.
Brazil is assumed to breeze through to the finals no matter what.
But are these teams really different?
How do “famous teams” like Brazil, Belgium, Argentina, or France perform compared to others?
Media References:
❓So… Are These Myths Real or Just Football Folklore?
In this project, we’re bringing these whispers and fan beliefs into the courtroom of data.
Using historical World Cup statistics, we put these gossips on trial.
Let the numbers speak the truth.
Keep reading to see what the data reveals about superstition, geography, and elite performance in the world’s most watched tournament.
Part II: Data Visualization – Testing the Gossips with Numbers
Hint: To explore the “superstar effect,” we used a dataset of Ballon d’Or winners from 1956 to 2024 as representative elite players, linking their World Cup match performances to team win rates and impact.
1. Do Superstar Players Actually Boost Win Rates?
One of the most popular fan theories says:
“If a Ballon d’Or winner is on the field, the team is more likely to win.”
To test this, we grouped all World Cup matches by whether any Ballon d’Or winner was playing.
Star vs Non-Star Matches
Teams with Ballon d’Or players had a 53.6% win rate.
Teams without them had only 35.9%.
This difference suggests that star players tend to appear in better-performing teams.
But correlation does not imply causation. Is it the star power, or simply that strong teams have star players?
What Do Individual Players Actually Contribute?
To dive deeper, we visualized each Ballon d’Or winner’s World Cup performance in a bubble chart:
- X-axis: Player’s total goals
- Y-axis: Win rate of their team when they played
- Bubble size: The average number of goals scored by the winning team in the games won by the player
Interpretation
Some players (e.g., Stoichkov, Messi) combined high goal counts with high win rates, showing strong impact.
Others (e.g., Cruyff, Modric) played well but in teams with mixed results.
Some legendary players (e.g., George Weah) never even appeared in the World Cup despite winning the Ballon d’Or.
Conclusion
Having a Ballon d’Or player is correlated with higher win rates.
2. Play in Your Backyard, Win the Match?
Supporters swear that a home crowd, local climate and zero travel turn host nations into giants. So we compared every World-Cup match where a team played as the tournament’s host (blue curve) with all other matches (orange curve).
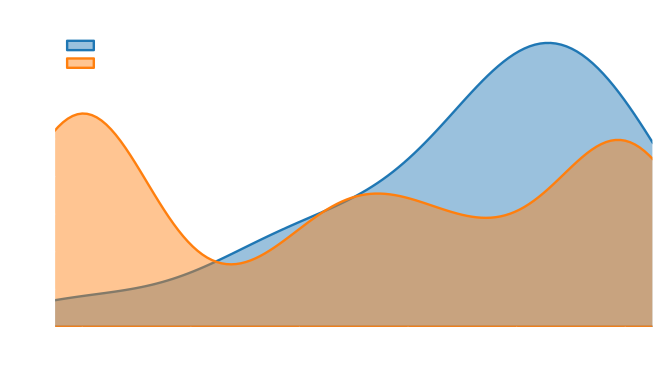
What does the data show:
Host teams average ≈ 0.74 win-rate
Non-hosts average ≈ 0.46 win-rate
That’s almost a 30-point jump; the KDE curve for hosts is clearly shifted to the right.
Why might this be?
Crowd & familiarity – constant local support and knowledge of the stadium conditions. Reduced fatigue – no cross-continent travel, jet-lag or altitude shock for the home side. Psychological lift – national expectation can boost motivation. Selection bias – host nations are often automatic qualifiers; weaker hosts (e.g., South Africa 2010, Qatar 2022) show the curve’s lower tail, proving advantage ≠ certainty.
The numbers back the gossip. Playing in your own backyard does raise the odds of winning, though elite visiting teams can still spoil the party.
3. Climate Conditions: Do Harsh Environments Suppress Performance?
We then examined whether the natural environment (heat, humidity, or altitude) affects play.
Using Köppen climate zones, we created two visualizations:
- Geographic climate-coded host cities:
- Average team win rate by climate type:
These charts show that:
Matches played in dry desert (BWh) and tropical rainforest (Af) climates tend to have lower win rates.
Unfamiliar or physically challenging environments likely reduce overall team effectiveness.
Combined Analysis: When Fan Atmosphere Meets Harsh Weather
To explore how these factors interact with team strength, we compared top-tier national teams (e.g., Brazil, France, Germany) against others across climates.
Boxplot view by broad climate zones:
Detailed interactive view by city and team group:
What we found:
- Top teams generally outperform others, but their advantage shrinks in extreme conditions.
- In tropical or desert climates, underdogs can close the gap, possibly because environment levels the playing field.
4. Case Studies – When Gossip Meets Reality
We have a few matches where fan theories and statistical outcomes meet:
Case 1: Messi’s Redemption in 2022 (Argentina vs. France)
- Tournament: FIFA World Cup Final, Qatar 2022
- Result: Argentina 3 – 3 France (Argentina won on penalties)
-
Messi Stats: 2 goals, 1 assist
Impact:
- Argentina’s win rate in games where Messi started reached ~85%
- Messi directly contributed to over 66% of Argentina’s goals during the tournament
- He received the Golden Ball as best player of the tournament
“If Messi plays, they win”? -This match makes a strong case.
Case 2: Heat Strikes Germany (Germany vs. Mexico, 2018)
- Location: Moscow (humid subtropical climate)
-
Result: Germany 0 – 1 Mexico
Notables:
- Germany struggled to match Mexico’s pace in the second half
- German media later questioned the team’s adaptation to summer heat
Supports the climate gossip; hot and humid days may erode performance.
These real-life match examples highlight how data can both debunk and reinforce popular football myths, showing that while gossip isn’t always right, it’s often grounded in reality.
Part III: Model Validation – Advanced Modeling
Hint: In this analysis, we used 2 models to predict whether the home team would win. The results showed that the models performed relatively well in predicting home team victories, with an accuracy of around 63%. The most important factors influencing the prediction were the number of star players, which had a significant impact on predicting home team wins. Additionally, whether the home team is a strong team and whether it is the host country also played key roles. Through feature importance analysis using the Random Forest model, we found that star players, strong team background, and home team advantage were the most influential factors in predicting match outcomes. Overall, the prediction of home team victories heavily relied on these factors, with star players having a particularly significant impact.
1. Binary Logistic Regression
Confusion Matrix:
Consider below factors: Historical performance of home and away teams (e.g., whether it has happened before, whether it is a strong team). Whether it is the host (whether the home team is the host of this World Cup). Stage of the competition (whether it is the knockout stage)
| Predicted: Win | Predicted: Loss | |
|---|---|---|
| Actual: Win | TP = 84 | FN = 22 |
| Actual: Loss | FP = 45 | TN = 29 |
- In 84 matches, the home team actually won and was correctly predicted (True Positives).
- In 29 matches, the home team lost and was correctly predicted (True Negatives).
- In 45 matches, the model incorrectly predicted a home team win (False Positives).
- In 22 matches, the model underestimated the home team, which actually won (False Negatives).
This indicates that the model is particularly effective at recognizing cases where the home team is likely to win, as reflected by its high recall.
Prediction:
- Top 10 Prediction Summary: The prediction results show that for most matches where the model predicted a win probability above 0.6, the home team indeed won (e.g., P=0.762, 0.925). The incorrect predictions mostly occurred around probability values close to 0.5, where the model itself expresses uncertainty. Meanwhile, the model correctly identified at least one clear case where the home team lost (e.g., P=0.303), showing that it retains some ability to discriminate in both directions Overall Summary: By incorporating the number of star players as a feature, the model not only improved its recall, but also showed a more confident distribution of predictions. It was better able to identify matches where the home team had a clear advantage (such as the presence of star players), thus improving the overall reliability and interpretability of its predictions.
Results below:
| Predicted: Win | Predicted: Loss | |
|---|---|---|
| Actual: Win | 6 | 2 |
| Actual: Loss | 4 | 4 |
Coefficient Analysis (Figure: Binary Logistic Coefficients)
Insights: This plot consider Star players (such as whether the home and away teams have star players); Stage of the game (whether it is a knockout match); Historical performance of the home and away teams (whether they are strong teams, whether they have won the World Cup, etc.) This plot represents the feature coefficients of a logistic regression model, showing how different features contribute to the prediction of the home team winning. The horizontal axis represents the coefficients, with longer bars indicating stronger relationships between the feature and the outcome. Positive values suggest that the feature increases the probability of a home team win, while negative values suggest it decreases the probability. Features such as “home_strong” (home team strength) have a positive coefficient, meaning that when the home team is strong, the model is more likely to predict a home win. On the other hand, features like “koppen_code_BWh” (climatic conditions) show a strong negative effect, indicating that matches with this climate type decrease the likelihood of a home win. The feature “away_is_winner” has a relatively weak effect on the prediction.
This analysis supports the core of our gossip theory: traditional powerhouses and favorable geography do increase win likelihood.
2. Random Forest Comparison – Is It Better?
We also trained a random forest classifier using the same feature set to see if nonlinear decision boundaries improved prediction.
Accuracy: 62.78%
Precision: 66.04%
Recall: 69.31%
F1 Score: 67.63%
The model performs relatively well in predicting home team victories, with an accuracy of 63%, indicating that it can correctly predict the outcome of most matches, especially when the home team wins. However, there are some shortcomings in the model, mainly in terms of false positives and false negatives. The false positives are 45, meaning the model incorrectly predicted a home team win when the actual result was a loss for the home team. The false negatives are 22, meaning the model failed to predict a home team win. The confusion matrix and classification report show that the model performs better in predicting home team victories, with a recall of 69%, indicating that the model can accurately identify most instances when the home team wins. However, the predictions for home team losses are not as accurate as for home team victories.
The model has a precision of 66%, recall of 69%, and an F1 score of 0.68, reflecting a good balance between precision and recall. Feature importance analysis reveals that star players (such as home_star and away_star) have a significant impact on the model’s predictions. These features are assigned high importance, indicating that the presence of star players plays a crucial role in predicting the outcome of a match. Additionally, traditional strong teams (such as Brazil, Germany, Argentina, etc.) are also prominently considered, with the model reflecting this influence through the home_strong and away_strong features. Other factors such as whether the home team is the host country and historical champions are also effectively incorporated into the model. Overall, while the model performs fairly accurately in predicting home team victories, there is still room for improvement, particularly in predicting home team losses.
Part IV: Discussion
What Went Well
Our project turned football rumors into measurable features like star players, climate, and home advantage. Interactive charts helped show clear patterns, and our models achieved around 63% accuracy. The results matched common fan beliefs — for example, teams with star players were more likely to win. Real match examples helped connect the data with actual events.
What Could Be Improved
Some features, like “star player” and “strong team,” may introduce bias due to overlap, and we didn’t account for variations in player performance over time — not all stars deliver in every match. Additionally, our rumor scoring system was manually designed and could be improved by using natural language processing to detect rumors more systematically. Lastly, our dataset was limited to men’s World Cups; incorporating women’s matches or qualifying games would provide a more complete picture.